Modern casino platforms generate enormous amounts of data.
Operators track:
-
Daily active users
-
GGR
-
Session counts
-
Game popularity
-
Conversion rates
Most dashboards are full of impressive charts and real-time graphs.
But here’s the uncomfortable truth:
Many operators are looking at the wrong numbers.
Or worse — interpreting the right numbers incorrectly.
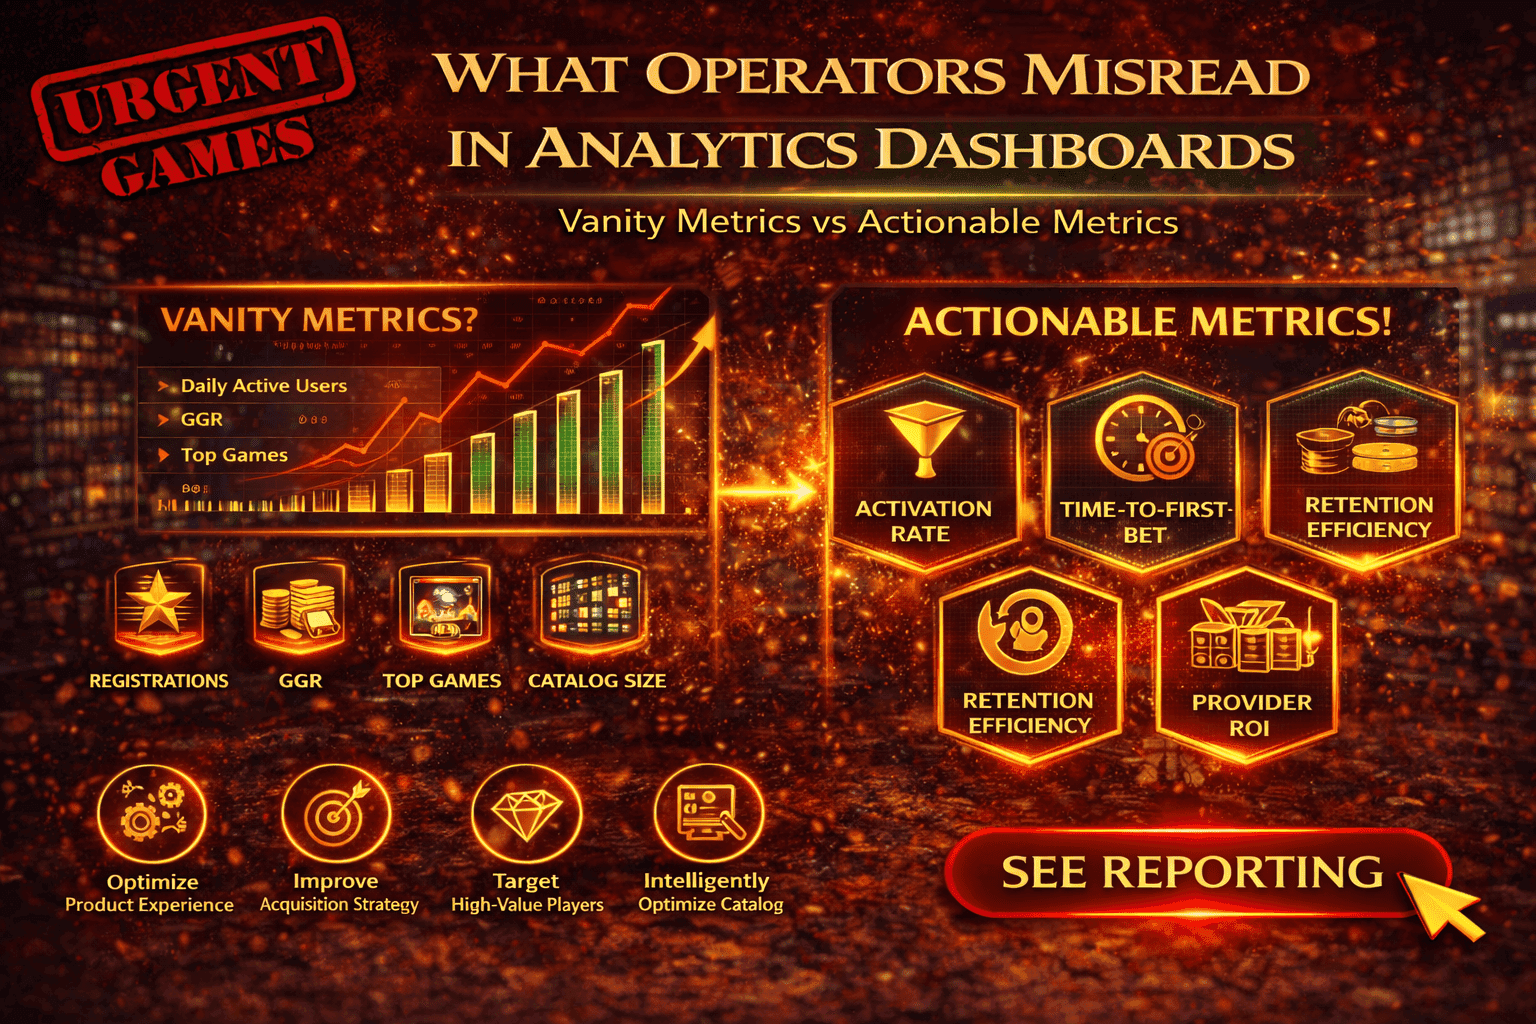
The difference between vanity metrics and actionable metrics is where real competitive advantage lies in casino analytics.
Let’s explore the most common misinterpretations and how smarter operators read their dashboards differently.
Vanity Metrics vs Actionable Metrics
Vanity metrics look impressive but rarely influence decisions.
Examples include:
-
Total registrations
-
Total games in catalog
-
Total sessions
-
Raw GGR numbers
These metrics show activity, but they don’t explain why performance happens.
Actionable metrics reveal leverage points.
They answer questions like:
-
Where users drop off
-
What drives retention
-
Which games increase LTV
-
Which providers deliver ROI
Strong casino analytics focuses on decision-making signals, not just activity levels.
Misread #1: Total Registrations
Many dashboards celebrate growing registration numbers.
But registration alone does not equal growth.
The real question is:
How many registrants actually activate?
The more useful metric is:
Registration → Deposit Conversion Rate
Even more insightful:
Registration → First Game Conversion
If thousands of users register but never play, acquisition spend is leaking value.
Smart operators prioritize activation rate, not just sign-ups.
Misread #2: GGR Without Context
GGR is one of the most common metrics in casino analytics dashboards.
But raw GGR hides important context.
Consider two providers:
Provider A
-
High GGR
-
High bonus spending
-
Short session depth
Provider B
-
Moderate GGR
-
Low promotional reliance
-
High repeat engagement
Which one performs better?
Without examining:
-
Bonus-to-GGR ratio
-
Retention contribution
-
Player lifetime value
GGR alone can mislead decision-making.
Profitability matters more than raw revenue.
Misread #3: “Top Games” Lists
Most dashboards show:
Top 10 Games by GGR.
While useful, this metric can be deceptive.
Why?
Because high exposure often drives high revenue.
Games featured on the homepage naturally receive more traffic.
The better question is:
Which games outperform their exposure?
A strong casino analytics model compares:
Game Revenue ÷ Game Visibility
This reveals hidden performers that deserve better placement.
Misread #4: Daily Active Users
DAU is frequently treated as a health indicator.
But DAU alone doesn’t show engagement quality.
A user who logs in for 10 seconds counts the same as one who plays for 30 minutes.
More meaningful metrics include:
-
Average session duration
-
Bets per session
-
Time-to-first-bet
-
Session frequency per player
These metrics reflect real engagement, not just login behavior.
Misread #5: Game Catalog Size
Operators often believe:
“More games means better performance.”
Dashboards may show:
-
Total game count
-
Number of providers
But catalog expansion does not automatically improve engagement.
In fact, too many options can cause decision fatigue.
Better metrics include:
-
Games played per user
-
Discovery efficiency
-
Catalog utilization rate
If only 5% of games generate most activity, the rest may be clutter.
Effective casino analytics highlights content performance, not just catalog size.
Misread #6: Deposit Volume
Deposit volume can appear as a strong growth signal.
But deposit size alone doesn’t guarantee long-term value.
Key questions include:
-
How quickly does the deposit convert into gameplay?
-
Does the player return after the first session?
-
What is the deposit-to-bet ratio?
Some users deposit once and disappear.
Others deposit smaller amounts but play consistently.
Long-term retention often matters more than initial deposit size.
Misread #7: Session Counts
Session counts are another metric that can mislead.
A platform may report:
“Sessions increased by 20%.”
But what caused the increase?
Possibilities include:
-
Shorter sessions
-
More fragmented gameplay
-
UX friction causing restarts
Instead of session count alone, operators should monitor:
-
Average session depth
-
Bets per session
-
Session duration distribution
Understanding session quality is more valuable than session volume.
What Smart Operators Actually Measure
The most mature casino analytics strategies focus on behavioral metrics.
Key examples include:
Activation Metrics
-
Registration → Deposit rate
-
Deposit → First Game rate
-
Time-to-first-bet
These reveal onboarding efficiency.
Engagement Metrics
-
Average bets per session
-
Session depth
-
Category engagement mix
These show product experience quality.
Retention Metrics
-
D1 retention
-
D7 retention
-
D30 retention
These metrics determine long-term revenue potential.
Content Performance Metrics
-
Revenue per game exposure
-
Provider ROI score
-
Volatility engagement patterns
These guide catalog optimization.
The Dashboard Design Problem
Sometimes the issue isn’t interpretation — it’s the dashboard itself.
Many reporting tools emphasize:
-
High-level KPIs
-
Aggregate numbers
-
Simplified visuals
But operational decisions require segmentation.
Strong casino analytics dashboards allow slicing by:
-
Player cohort
-
Geography
-
device type
-
acquisition source
-
game category
Without segmentation, patterns remain hidden.
The Shift from Reporting to Intelligence
In the past, dashboards were used primarily for reporting.
Today, they must drive decision-making.
Modern analytics systems focus on:
-
Behavioral insights
-
Predictive signals
-
real-time alerts
-
automated optimization
This shift transforms dashboards from information displays into growth tools.
The Strategic Advantage
Operators who interpret casino analytics correctly gain powerful advantages:
-
Faster product optimization
-
Smarter provider selection
-
Better player segmentation
-
Higher retention efficiency
-
Improved marketing ROI
Those who rely on vanity metrics often make reactive decisions.
Those who focus on actionable metrics make strategic ones.
Final Thought
Data is not the advantage.
Understanding the right data is.
Dashboards filled with impressive numbers can still hide weak insights.
The best operators don’t just track activity.
They track the signals that drive growth.
📊 See Reporting
If you’re ready to move beyond vanity metrics and unlock actionable casino analytics, it’s time to build reporting systems that highlight what truly drives performance.
Turn data into strategic insight.