
 Svenska
  English
  简体中文
简体中文  Español
  Русский
  Türkçe
  Tiếng Việt
  Українська
  Български
  Suomi
Suomi  Ελληνικά
  Čeština
  اردو
اردو  עִבְרִית
  हिन्दी
  Français
  Հայերեն
  Italiano
  日本語
日本語  Română
  Polski
  Српски језик
  Latviešu valoda
  Deutsch (Sie)
  Português do Brasil
  한국어
한국어 
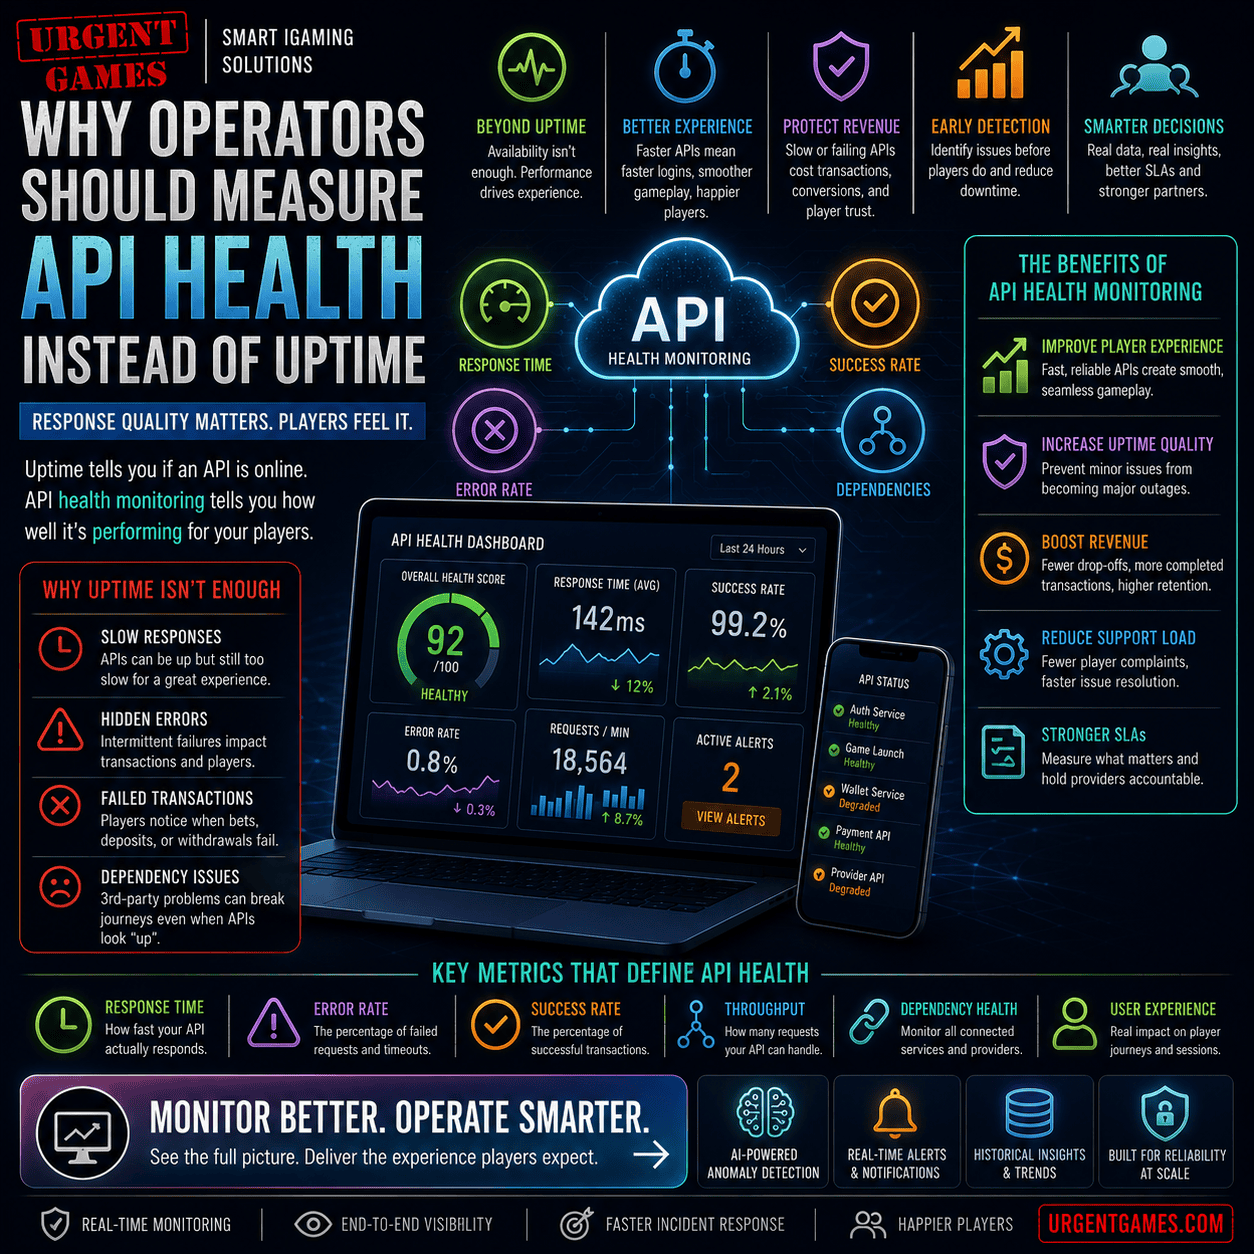
API Health Monitoring: Why Uptime Metrics Lie in Modern iGaming
For decades, basic network availability has been the default metric used to evaluate technology infrastructure providers. Because it is simple to calculate, almost every legacy casino engine vendor proudly advertises standard availability metrics like 99.9%, 99.95%, or even 99.99% system uptime.
While these surface figures sound deeply impressive on sales brochures, they only tell a very small fraction of the operational story. In reality, an integration point can be technically “online” according to basic pings while still delivering a broken player experience due to lagging response times, intermittent data drops, degraded database execution, or totally failed payment processing.
Therefore, simply asking whether a endpoint is accessible is no longer sufficient for modern competitive platforms. Instead, operations teams must shift their entire focus toward comprehensive API health monitoring—a technical observability strategy that evaluates not just binary availability, but the quality, transaction velocity, and long-term consistency of every database connection.
Why Standard Uptime Fails the Player Experience
A gateway can technically return a successful response code to a load balancer and still utterly fail to meet necessary business expectations. When infrastructure begins to buckle under high concurrent traffic, the cracks appear in performance degradation rather than absolute server crashes.
Consider these realistic scenarios that go completely undetected by standard uptime tests:
Dreaded Authorization Latency: Account login requests take up to 10 seconds to pass token authentication.
Failed Session Handoffs: Third-party game launches consistently trigger timeout errors for users.
Desynchronized Balance Calls: Core wallet transactions lag behind actual spin outcomes.
Intermittent Transaction Drops: Payment processing gateways occasionally drop packets during deposit attempts.
[Server Ping Response: 200 OK] ── (Hidden DB Lockup) ──> [10-Second Game Launch Timeout]
Ultimately, availability without matching speed yields zero commercial value. If a player experiences broken loops during a high-stakes session, they will simply abandon your brand for a competitor.
Technical Core of API Health Monitoring
Unlike basic, traditional uptime tracking engines that perform nothing more than an entry-level ping check, comprehensive API health monitoring evaluates the end-to-end telemetry lifecycle of your connections.
Modern observability systems look deep into complex metrics:
P95/P99 Response Latency: Evaluating data payload speeds across your slowest percentiles to protect player retention.
Granular Internal Error Rates: Spotting localized anomalies before they cause widespread outages.
Transactional Success Matrices: Verifying that complete mutations—like credit card settlements—successfully commit to the database.
Downstream Dependency Tracking: Monitoring the health of third-party aggregation pipelines, CRM triggers, and identity verification endpoints.
Implementing Proactive Testing and Synthetic Pipelines
To catch performance drops before they trigger waves of negative reviews on player forums, operations teams must deploy aggressive synthetic testing loops.
Instead of waiting for a user to complain about a broken deposit button, automated script engines should continuously simulate complete player journeys through your production environment.
Structuring Modern Service Level Agreements (SLAs)
Because classic availability metrics hide massive performance drops, savvy engineering leaders are entirely rewriting their corporate provider contracts.
When negotiating terms with critical game aggregators or payment processors, ensure your contracts are tied directly to real-world API health monitoring criteria rather than empty uptime percentages:
| Critical SLA Constraint | Minimum Performance Threshold | Operational Enforcement |
| Max Game Launch Latency | $\le 1.5 \text{ seconds}$ | Triggers service credits if P99 execution degrades over a rolling hour. |
| Allowable Error Budget | $\le 0.01\%$ | Counts internal HTTP 5xx errors as immediate service breaches. |
| Dependency Timeout Cap | $\le 200 \text{ ms}$ | Mandates decoupled, asynchronous fallbacks if processing nodes slow down. |
For deep-dive architecture patterns on managing high-velocity connection states without adding heavy database locks, review our technical guide to low-latency casino caching setups.
Common Observability Mistakes to Eliminate
DevOps Operational Warning: Flooding your engineering channels with noisy, unstructured alerts is just as dangerous as having no monitoring metrics at all.
Measuring Availability via Isolated Gateways: Passing a basic gateway check means nothing if the secondary database layer is locked up. Always monitor full, end-to-end transactional workflows.
Allowing Alert Fatigue to Blind Your Response Teams: If your monitoring suite fires alerts for minor, temporary spikes, engineers will eventually ignore the notifications entirely. Build smart, trend-based warning limits instead.
Ignoring the Intermittent Performance Drops of Sub-Providers: Third-party integration updates can quietly introduce severe memory leaks. Maintain clear, isolated observability graphs for every integration endpoint you run.
To discover how these data connections scale securely under heavy user traffic, explore our companion manual on enterprise casino game session management systems.
Achieving Total Observability with Social Auto Post
Moving your organization from reactive damage control to proactive system optimization requires enterprise-grade infrastructure visibility.
This is exactly why the Social Auto Post system architecture is designed with comprehensive API health monitoring built into its core engine. Our unified orchestration dashboard provides engineering teams with real-time dependency status tracking, automated incident alerts, deep synthetic loop testing, and explicit transactional data tracking. By systematically monitoring your backend performance, our tools ensure your platform remains fast, reliable, and perfectly aligned with the exact experiences your players expect.
Modernize Your Platform Infrastructure
Maintaining highly resilient digital infrastructure requires combining robust code architectures with advanced, real-time observability. To continue improving your platform’s operational reliability, take a look at our companion implementation guides.