
You Can’t Fix What You Don’t Measure
Most operators integrate multiple providers:
slots
live casino
crash games
instant games
Each provider promises:
high uptime
fast performance
stable APIs
But in reality, performance varies constantly.
Some providers degrade during peak hours.
Others struggle with latency spikes.
Some fail silently.
Without structured provider health monitoring, operators rely on guesswork.
And guesswork leads to:
poor player experience
hidden revenue loss
inefficient provider prioritization
The solution is simple:
Measure provider health objectively.
Why Provider Health Matters More Than Catalog Size
Operators often focus on:
number of providers
number of games
content diversity
But player experience depends on:
how fast games load
how often sessions fail
how reliable transactions are
A platform with fewer but stable providers often outperforms one with a massive but unreliable catalog.
This is why provider health monitoring is essential for operational excellence.
The Problem: No Standard Way to Measure Providers
Most operators evaluate providers using basic metrics like:
total GGR
number of sessions
game popularity
These metrics don’t reflect technical performance.
A provider may generate revenue but still cause:
slow loading times
failed sessions
player frustration
To optimize effectively, operators need a technical scoring model.
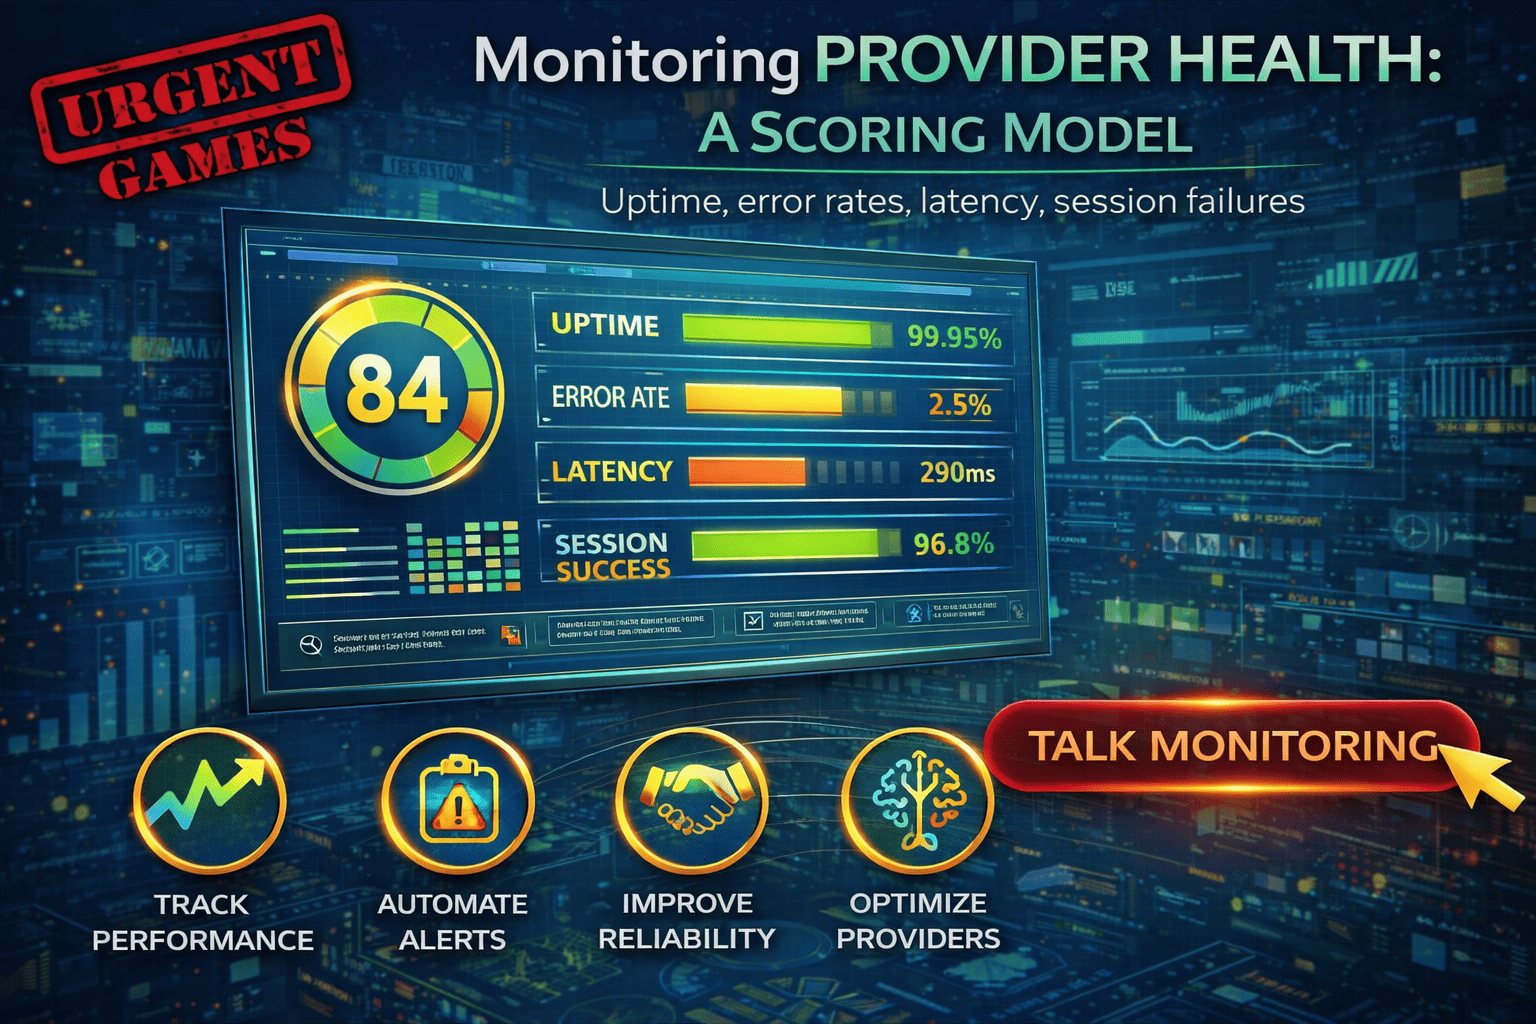
The Provider Health Scoring Model
A strong provider health model combines multiple performance signals into a single score.
Core metrics include:
uptime
error rate
latency
session success rate
Each metric represents a different dimension of reliability.
1. Uptime (Availability Score)
Uptime measures how often a provider is accessible.
Formula:
Available Time ÷ Total Time
Example:
99.95% uptime = excellent
99.5% uptime = acceptable
below 99% = problematic
Even small drops in uptime can impact thousands of player sessions.
Uptime is the foundation of provider health.
2. Error Rate (Stability Score)
Error rate tracks how often provider requests fail.
Examples of errors:
API failures
failed game launches
transaction errors
timeout responses
A high error rate directly impacts player experience.
Even if uptime is high, frequent errors can make a provider unreliable.
3. Latency (Performance Score)
Latency measures how quickly a provider responds.
Slow response times lead to:
delayed game loading
laggy gameplay
frustrated users
Typical benchmarks:
<200ms → excellent
200–500ms → acceptable
500ms → poor
Latency is especially important for mobile users and real-time games.
4. Session Success Rate (Experience Score)
This metric tracks how many sessions complete successfully.
It considers:
successful game launches
uninterrupted gameplay
proper session closures
A low session success rate indicates deeper issues such as:
unstable integrations
callback failures
session interruptions
This is one of the most important metrics for real player experience.
Building the Composite Health Score
To simplify decision-making, these metrics are combined into a single score.
Example weighting model:
Uptime → 30%
Error Rate → 25%
Latency → 20%
Session Success → 25%
Each provider receives a score between 0–100.
This allows operators to:
compare providers objectively
identify weak performers
prioritize improvements
The exact weighting can vary depending on platform priorities.
Why a Scoring Model Changes Everything
Without a scoring model:
decisions are subjective
issues are detected late
provider performance is unclear
With a scoring model:
problems become visible instantly
comparisons become data-driven
optimization becomes systematic
This transforms provider management from reactive to strategic.
Real-Time Monitoring vs Historical Analysis
A complete provider health system includes both:
Real-Time Monitoring
Tracks live performance:
current uptime
active error spikes
latency fluctuations
This enables immediate action, such as:
disabling unstable providers
rerouting traffic
triggering alerts
Historical Analysis
Tracks long-term trends:
performance over days/weeks
peak-hour degradation
recurring failure patterns
This helps operators:
evaluate provider reliability
negotiate contracts
optimize catalog strategy
Both perspectives are essential.
How Operators Use Health Scores
Once implemented, provider health scores influence several decisions.
1. Lobby Placement
High-performing providers receive:
better visibility
homepage placement
recommendation priority
Low-performing providers are deprioritized.
2. Traffic Routing
Platforms can dynamically route players toward healthier providers.
This improves:
session success rates
overall user experience
3. Provider Negotiation
Operators can use performance data in discussions with providers.
Instead of opinions, they present:
uptime trends
error rates
latency benchmarks
This creates accountability.
4. Incident Management
Health monitoring systems can trigger alerts when scores drop.
This allows teams to:
react quickly
minimize impact
maintain platform stability
The Role of Automation
Modern systems automate provider health monitoring through:
real-time data pipelines
automated scoring calculations
alerting systems
dashboard visualization
Automation ensures that monitoring is:
consistent
scalable
always active
Manual monitoring is not sufficient at scale.
The Competitive Advantage
Operators with strong provider health monitoring gain:
better player experience
higher session success rates
improved retention
optimized provider performance
Operators without it often:
react too late
rely on incomplete data
struggle with hidden issues
In a competitive market, technical performance directly impacts growth.
The Future: Intelligent Provider Optimization
The next step in provider health monitoring is automation-driven optimization.
Future systems will:
automatically adjust provider exposure
predict performance degradation
reroute traffic proactively
optimize player journeys in real time
This transforms monitoring into active performance management.
Final Thought
Not all providers perform equally.
But without measurement, they appear the same.
A structured provider health monitoring model reveals the truth behind performance.
And once you can measure it, you can optimize it.
⚙️ Talk Monitoring
If you want smarter provider health monitoring with real-time scoring, automated alerts, and performance-driven optimization, the right platform architecture makes it possible.
Turn provider data into actionable insight.