
Game provider performance should be measured using ROI — not just GGR. While revenue volume looks impressive, it rarely tells the full story about profitability.
Most operators focus on output. However, sustainable growth depends on efficiency.
Let’s break down how to evaluate providers objectively.
Why GGR Alone Distorts Performance Evaluation
At first glance, GGR appears to be the most important metric. After all, it shows raw revenue contribution.
However, GGR without context hides inefficiencies.
For example:
Provider A
High GGR
Heavy bonus usage
Low repeat play
Provider B
Moderate GGR
Strong retention
Lower incentive dependency
Without ROI modeling, it’s impossible to know which one truly drives profit.
If you need a formal definition of GGR, see:
https://www.investopedia.com/terms/g/gross-gaming-revenue.asp
For industry benchmarking data:
https://www.statista.com/topics/3119/online-gambling/
Revenue shows scale. Profitability shows strength.
The 5 Metrics That Actually Matter
To evaluate providers properly, build a weighted model across five dimensions.
1. Net Revenue per Active Player
Formula:
Net Revenue ÷ Unique Active Players
This metric reveals monetization depth.
In other words, it shows how much value each engaged player generates.
If traffic is high but revenue per player is low, session quality may be weak.
2. Bonus-to-GGR Ratio
Formula:
Bonus Cost ÷ GGR
A high ratio signals promotional dependency.
By contrast, a lower ratio suggests organic engagement.
Because bonuses directly impact margin, this metric strongly influences ROI.
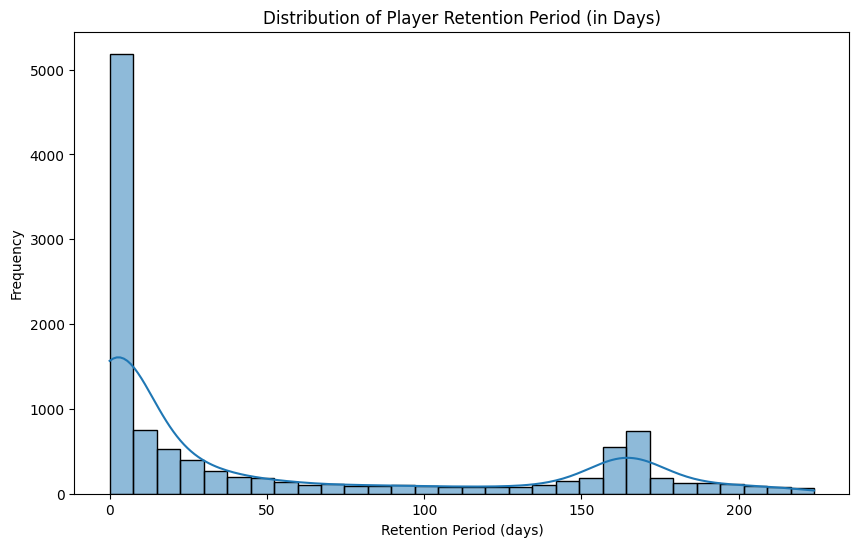
3. Retention Contribution (D1, D7, D30)
Retention shows whether players return.
Some providers drive strong Day 1 activation.
Meanwhile, others build long-term engagement.
Both roles matter. However, their value differs strategically.
For deeper behavioral insight into habit loops:
https://www.nirandfar.com/hooked/
4. Session Depth and Bet Frequency
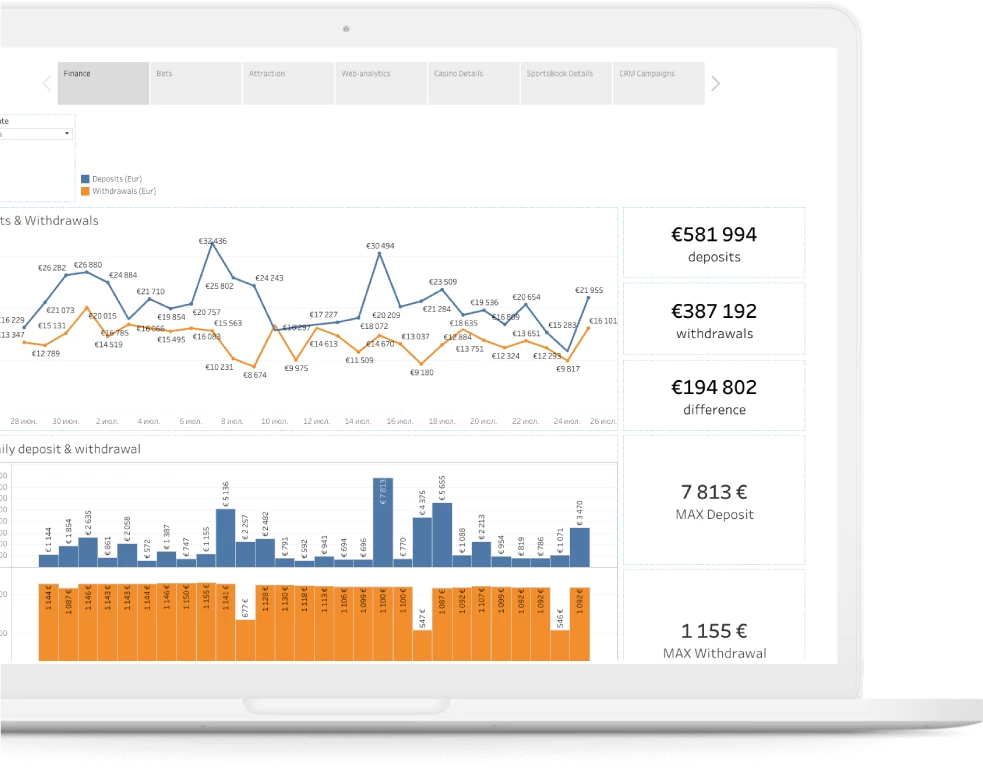

Recommended alt text example:
“game provider performance session depth analytics dashboard”
Track:
Average session duration
Bets per session
Bet frequency per minute
Generally, deeper sessions correlate with higher lifetime value.
Additionally, they improve cross-sell potential.
5. Revenue Stability and Variance
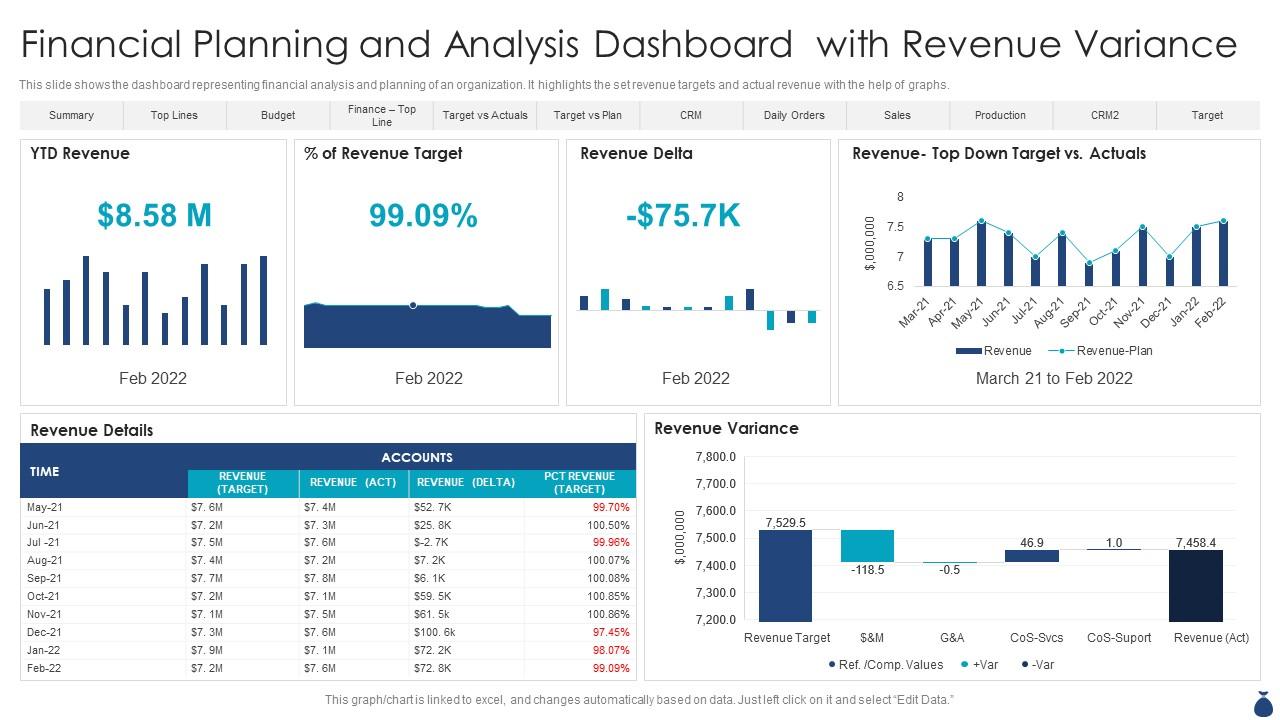


Recommended alt text example:
“game provider performance revenue stability comparison”
Some providers generate revenue spikes.
Others create predictable weekly baselines.
Ideally, a portfolio should balance both risk and stability.
Building a Practical Scoring Model
To rank providers fairly, normalize each metric on a 1–10 scale.
Then apply weights:
Net Revenue per Player → 30%
Bonus Efficiency → 20%
Retention Impact → 20%
Session Depth → 15%
Revenue Stability → 15%
Finally, calculate:
Composite Score = Sum (Metric × Weight)
As a result, decisions become structured rather than emotional.
If you’re refining your analytics stack, you may also find useful:
/provider-kpi-dashboard-framework
/bonus-optimization-strategy
/casino-retention-modeling
These internal resources expand on measurement strategy.
Strategic Impact of Structured Ranking
Once providers are ranked objectively, several improvements follow.
First, lobby positioning becomes data-driven.
Instead of promoting the loudest brand, you promote the most efficient one.
Second, bonus budgets become more precise.
High-performing providers often require less incentive support.
Third, commercial negotiations improve.
When discussions are backed by retention and efficiency metrics, leverage increases.
Common Evaluation Mistakes
Many operators still rank providers by total revenue alone.
Unfortunately, this favors size over efficiency.
Another frequent mistake is ignoring player segments.
Performance often varies by geography, device, and acquisition channel.
Finally, static evaluation creates blind spots.
Because player behavior changes, scoring should be updated continuously.
A Shift From Catalog Size to Precision
In the past, scale was the strategy.
Today, precision wins.
Rather than expanding integrations endlessly, successful operators optimize exposure, reduce bonus burn, and protect margin through structured measurement.